Panagos, P.^a^, Köningner, J.^a^, Ballabio, C.^a^, Liakos, L.^a^, Muntwyler, A.^a^, Borrelli, P.^b^ , Lugato, E.^a^, 2022. Improving the phosphorus budget of European agricultural soils. Science of The Total Environment 158706. https://doi.org/10.1016/j.scitotenv.2022.158706
^a^ European Commission, Joint Research Centre (JRC), Ispra, Italy
^b^ Department of Science, Roma Tre University, Rome, Italy
Despite phosphorus (P) being crucial for plant nutrition and thus food security, excessive P fertilization harms soil and aquatic ecosystems. Accordingly, the European Green Deal and derived strategies aim to reduce P losses and fertilizer consumption in agricultural soils. The objective of this study is to calculate a soil P budget, allowing the quantification of the P surpluses/deficits in the European Union (EU) and the UK, considering the major inputs (inorganic fertilizers, manure, atmospheric deposition, and chemical weathering) and outputs (crop production, plant residues removal, losses by erosion) for the period 2011–2019.
The Land Use/Cover Area frame Survey (LUCAS) topsoil data include measured values for almost 22,000 samples for both available and total P. With advanced machine learning models, we developed maps for both attributes at 500 m resolution. We estimated the available P for crops at a mean value of 83 kg ha−1 with a clear distinction between North and South. The ratio of available P to the total P is about 1:17.
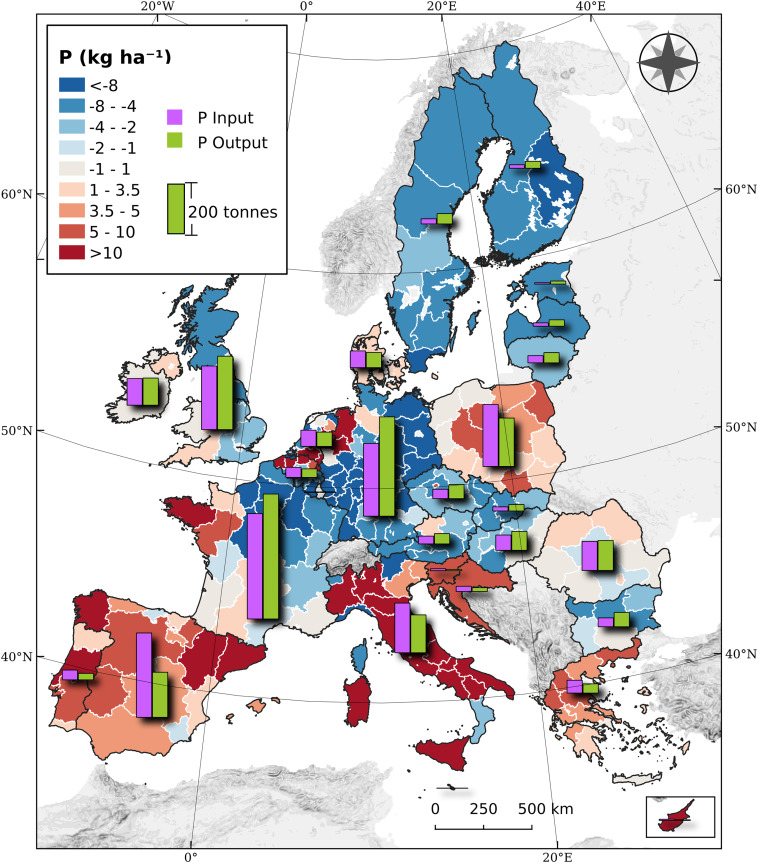
The inorganic fertilizers and manure contribute almost equally as P inputs (mean 16 ± 2 kg P ha−1 yr−1 at 90 % confidence level) to agricultural soils, with high regional variations depending on farming practices, livestock density, and cropping systems. The P outputs came mainly from the exportation by the harvest of crop products and residues (97.5 %) and, secondly, by erosion. Using a sediment distribution model, we quantified the P fluxes to river basins and sea outlets.
In the EU and UK, we estimated an average surplus of 0.8 kg P ha−1 yr−1 with high variability between countries with some regional variations. The P annual budget at regional scale showed ample possibility to improve P management by both reducing inputs in regions with high surplus (and P soil available) and rebalancing fertilization in those at risk of soil fertility depletion.
Comments
comments powered by Disqus