Panagos, P.a, De Rosa, D.a, Liakos, L.b, Labouyrie, M.a,c, Borrelli, P.^d, e^, Ballabio, C., 2024 a. Soil bulk density assessment in Europe. Agriculture, Ecosystems & Environment 364, 108907. https://doi.org/10.1016/j.agee.2024.108907.
a. European Commission, Joint Research Centre (JRC), Ispra, Italy b. UNISYSTEMS, Bertrange, Luxembourg c. Department of Plant and Microbial Biology, University of Zurich, Zürich, Switzerland d. Department of Science, Roma Tre University, Rome, Italy e. Department of Environmental Sciences, Environmental Geosciences, University of Basel, Basel, Switzerland
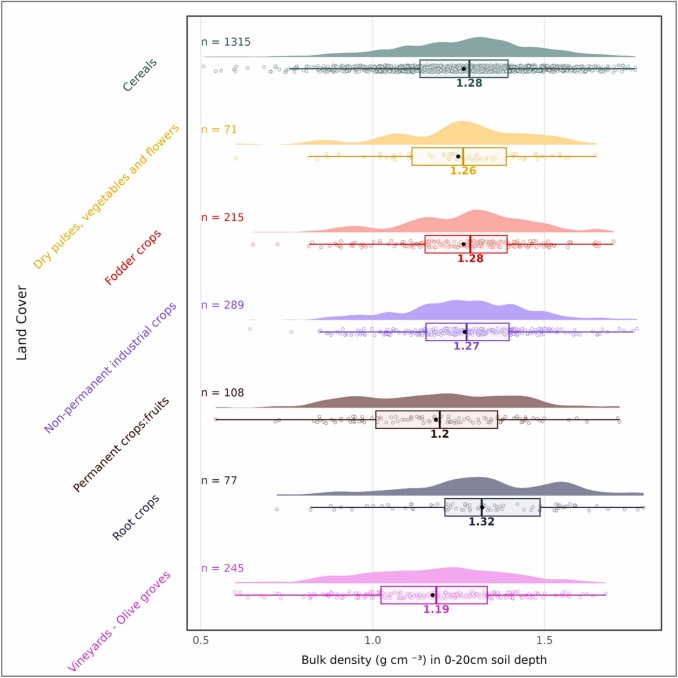
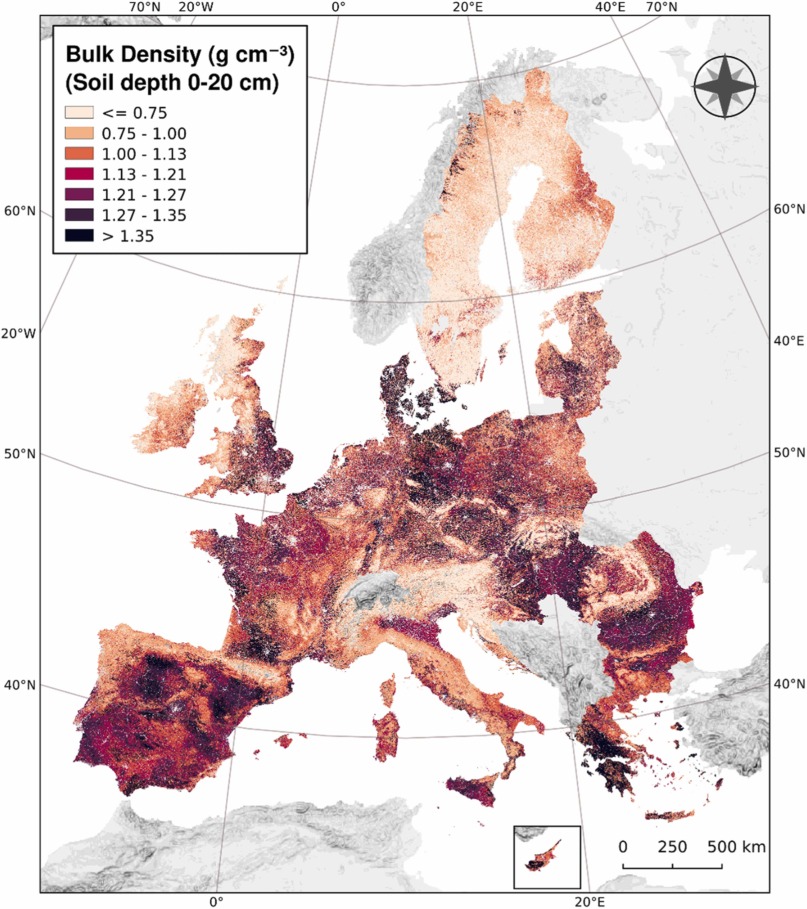
The topsoil Land Use and Cover Area frame Statistical survey (LUCAS) aims at collecting harmonised data about the state of soil health over the extent of European Union (EU). In the LUCAS 2018 survey, bulk density has been analysed for three depths, i.e., 0–10 cm = 6140 sites; 10–20 cm = 5684 sites and 20–30 cm =139 sites. The laboratory analysis and the assessment of the results conclude that the bulk density at 10–20 cm is 5–10% higher compared to 0–10 cm for all land uses except woodlands (20%). In the 0–20 cm depth, croplands have 1.5 times higher bulk density (mean: 1.26 g cm−3) compared to woodlands (mean: 0.83 g cm−3). The main driver for bulk density variation is the land use which implies that many existing pedotransfer rules have to be developed based on land use. This study applied a methodological framework using an advanced Cubist rule-based regression model to optimize the spatial prediction of bulk density in Europe. We spatialised the circa 6000 LUCAS samples and developed the high-resolution map (100 m) of bulk density for the 0–20 cm depth and the maps at 0–10 and 10–20 cm depth. The modelling results showed a very good prediction (R2: 0.66) of bulk density for the 0–20 cm depth which outperforms previous assessments. The bulk density maps can be used to estimate packing density which is a proxy to estimate soil compaction. Therefore, this work contributes to monitoring soil health and refine estimates on carbon and nutrients stocks in the EU topsoil.
Comments
comments powered by Disqus